Tabsters Help Center

No results, try something else
Thank you! Your submission has been received!
Oops! Something went wrong while submitting the form.

Release Note 8.12

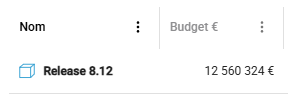
Here's what's new in Tabsters V 8.12 release

Budget - Redesign :

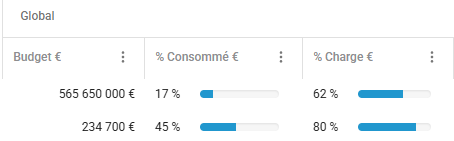
The Budget tab gets a makeover!

  • The display of budget data is now grouped by year, making it easier to distinguish budget data by year.

  • You can define the years you wish to see displayed in your view, from the choice of columns. A 'global' option is also available in the list to view total budget data.
  • Numerical budget data fields are now displayed for each of the years you have set up in your view.
  • Excel & PPT exports of budget data and the import mechanism have been adapted to match the new format.

Tabs - New tabs & Display :

New tabs can now be defined and others hidden.
Exportable to Excel and/or PPT.

  1. Definition & Settings by Tabsters for the moment:
    Levels, With or without Aggregation, With or withoutMD workload addition. The list of fields is left up to you via custom fields.
  2. You can choose which tabs to show/hide at each level. Valid for all native & custom tabs.
    Position yourself on the desired level: from the Dashboard tab, click on the level icon (top left) and select 'Choose tabs'.

Risks - Underlying action :

It is now possible to define corrective actions for your risks as a child of the latter.

The type of child element generated can be configured(currently only by Tabsters).

It is possible to see these actions created under risks in another tab, for better management (e.g. Incidents, Decisions, new tabs...).

Roadmap - Access to budget data :

To enable better data tracking & analysis, certain budget data have been made accessible in the Roadmap tab.

You can now access the Budget amount, % workload €, % burned € and Budget in MD fields from your Roadmap, in accordance with the data you have entered in the budget tab.

Capacity planworkload) - New Capacity & Availability indicators :

In the workload tab of team & resource cards, a new 'Capacity' field has been added.


This field corresponds to the work capacity of each resource, corresponding to the delta of the number of working days versus absences.

The bandwidth of each resource is also taken into account in the calculation.

A new 'Availability' field has also been added, corresponding to the delta between the resource's capacity and its remaining workload.

Custom fields - New field types :

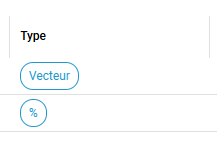
New custom field types have been added:

  • Vector' field : Following on from the redesign of the Budget tab in Tabsters, the vector field is a numeric-type field that will be positioned under each of the years you've defined in your display (similar behavior to the native numeric-type fields in the Budget tab)
  • %' field : The % field lets you create custom fields in the form of a progress bar, offering a visual similar to the 'Progress' field in the application

The calculation of custom formula fields positioned on the budget tab has also been realigned.

Templates - News & Enhancements :

    • For all creations blue '+' button with/without template : A new design has been implemented, a click has been gained

      • with template : you can choose between a list of templates or an empty element.
      • no template : the element is created directly.
    • Roadmap : Custom fields filled in roadmaps defined as templates are now preserved and duplicated (which completes the current operation of "native" fields) when creating from a template.
    • Risks : Risks can now be generated from a template (based on risks present in projects defined as templates).
      Underlying actions are also taken into account in templates.

    Miscellaneous news :

    • Display level - fold tree structure :
      • It is now possible to fold the Roadmap tree via the display level (pyramid), "up to the level" desired.
    • Login - Improved SSO login mode :
      • Improved SSO login system, with no need to go to a Tabsters page on login or enter your login details twice.
    • TJM - Time management :
      • It is now possible to define average daily rates (ADRs) for resources by date, enabling you to keep a record of the resource's ADR at a given time, should it change, so as not to impact calculations of the sums consumed by the resources.
    • Time recording - Resource: New indicators :
      • New progress indicators have been added to the resource tab of team cards, allowing you to view the progress of resource timesheet entries(% time week, % time previous week, % time month, % time previous month).
        A fix has also been implemented to prevent the positioning of absences on weekends & public holidays.
    • Graphics - Various improvements :
      • Add 'Average' option for all indicators
      • entity axes added as an option in workload & burned tab charts
      • Improved label display for widget graphs configured with Axis fields configured for the X axis (labels now appear in the same way as in tables, including formatting).
      • Conditional formatting added for graphs displayed in table mode (also taken into account when exporting to PPT)
    • HTML fields - Various improvements :
      • Realignment of copy/paste within HTML fields, including formatting of data pasted from one HTML field to another
      • Possibility of adding screenshots (NB: they will not be visible in Excel/PowerPoint exports).
    • Application - Screenshots :
      • Correction of screen pop-ups when modifying data in tables on the application's various tabs
    • S-curve - Correction :
      • Realignment of the initialization of the theoretical progression curve and its display for workload items in the future
    • Planning - Week numbers :
      • Realign display of week numbers in Gantt planning views.
    • Resource - Breadcrumb :
      • The breadcrumb trail (hierarchy) is now accessible from every tab on the resource cards.
    • Notifications - Improvements :
      • Realignment of notifications positioned on the project manager field & removal of notifications when editing by yourself.
    • Progression trends - Improvement :
      • Added progress bar display for progress trend & progress trend [Reference] fields when value is 0.
    • Dashboard - Improvement :
      • Realignment of graph display in dashboard mini-blocks.
    • Filters - Adding a loading spinner :
      • A loading spinner has been added to the filter pop-up to indicate data loading.
    • PPT - Various improvements :
      • Gantt :
        • Add a line-height parameter to slides
        • Possibility of exporting only one period (according to the custom time limits defined in the view to be exported)
      • Risk :
        • Addition of an option to display the risk matrix as a heat matrix, configurable from the risk view slide parameters.
        • (Option not present by default on environments, can be activated on request from Tabsters)
      • General :
        • Added the ability to display slide headers on all webview slides (not just roadmap slides).
        • Remove '-NA-' values from axes in PPT exports
        • Reduction of spaces between lines/blocks of different elements, especially when HTML‍ type fields are used.
    • Various realignments :
      • Realigning budget donut data with budget view slides
      • Realign data display in slides with Gantt view
      • Realignment of sorting in template planning slides & display of elements passing through the chosen time milestone
      • Realignment of widget display in Dashboard slide mini-blocks
      • Realignment of traffic-light meteo display option in detail view & Dashboard slides
      • Realign display of certain data in graphs exported as PPTs
      • Realigning resource view slides
      • Realign display of multi-value fields in view slides
      • Realignment of performance calculation for earnings in dashboard template slides
      • Realignment of gaps in Dashboard view slides
      • Realignment of view access via the eye in the case where the view slide is positioned on 'all elements' towards the view, positioned on the first element.
      • Realignment of exports in workload view slides
    Have you found your answer?
    Thank you, your opinion counts!
    Oops! Something went wrong while submitting the form.
    Budget - Redesign :Tabs - New tabs & Display :Risks - Underlying action :Roadmap - Access to budget data :Capacity plan (Load) - New Capacity & Availability indicators :Custom fields - New field types :Templates - News & Enhancements :Miscellaneous new features :

    Can't find what you're looking for?

    Don't worry, you can contact us at support@tabsters.fr specifying the nature of your request. Our agents will get back to you as soon as possible.
    Contact us