Check out the new features in Tabsters version 9.12 here
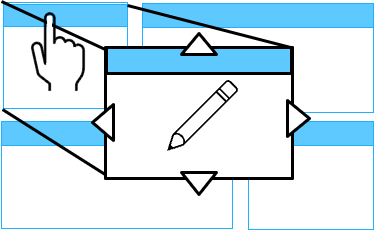
Dashboards are evolving to let you modify the displayed data directly from the corresponding widget .
You no longer need to go to the corresponding tab to edit the displayed data; simply click on the mini-block to open the editing pop-up and make your changes in real time.
In addition, the selected mini-block expands to allow you to read all the information more easily (with no limit on the number of lines displayed).
(Note: Editing data from the mini-blocks follows the same rules as editing data from the tab.
Editing applies to the "table" and "kanban" view types. The "chart" and "Gantt" view types remain read-only.)
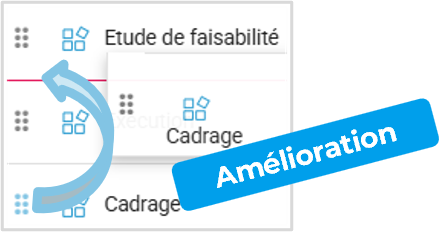
Following up on the improvements made to the drag-and-drop feature, two new enhancements have been added:
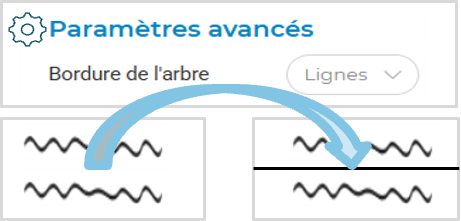
In the roadmap, it is now possible to add a visual separator between each line using a new "Tree Border"setting in the advanced settings.
Two possible values:

The red error banner that displays errors encountered while using the Tabsters tool now appears as a floating notification and will disappear after 10 seconds, rather than remaining permanently at the top of your screen.

The filter pop-up interface has been updated to more clearly indicate the two available filter types—filters and advanced filters—and a new“Clear All”button has been added to allow users to remove all applied filters with a single click.
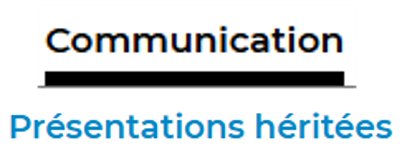
The "Communication" tab interface now clearly distinguishes between PPT presentations for this item and PPT presentations inherited from higher levels (provided that any of their slides pertain to this item). Additionally, to avoid confusion, it is no longer possible to duplicate or delete inherited presentations.
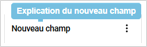
Users authorized to edit custom fields can now add a tooltip for each field. When the mouse hovers over the field, the tooltip displays a brief description of the field’s intended use or how to use it.


